Half Moon Bay September 2026 Market Report
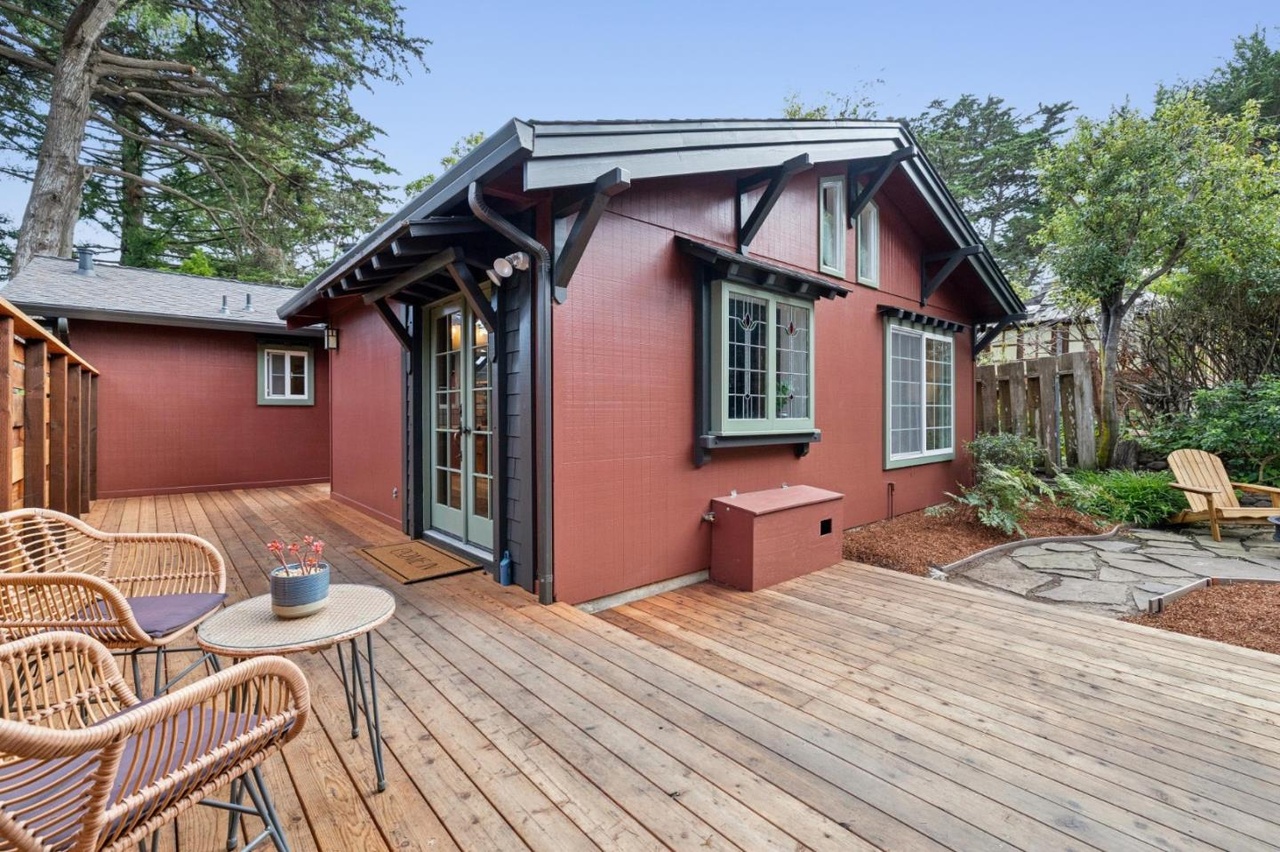
The period at a glance
| Metric | September 2026 |
|---|---|
| Closings | 8 |
| Total volume | $13,875,000 |
| Median price | $1,620,000 |
| Median price per sq ft | $941 |
| Price range | $915,000 – $2,600,000 |
| Active listings (end of period) | 34 |
| Pending listings (end of period) | 5 |
| Median active list price | $2,270,000 |
Eight closings is a small sample — treat every figure here as a snapshot, not a trend line. The month produced $13.875 million in combined volume across seven single-family homes and one townhouse, with a median sale price of $1,620,000 and a median price per square foot of $941. No year-over-year comparison is possible: the data carries no confirmed closings for September 2025.
The spread between the bottom of the range ($915,000 for a 1996 townhouse on Erin Lane) and the top ($2,600,000 for a brand-new five-bedroom on Creekside Court) is wide enough that the median describes the middle of the distribution more than it describes any typical transaction. Four of the eight closings lacked list prices in the source data, so the against-asking analysis below covers only the four sales for which list prices were recorded.
The sales
| Address | Segment | Beds/Baths | Sq Ft | Sale Price | $/Sq Ft | % of List | Closed |
|---|---|---|---|---|---|---|---|
| 568 Creekside Court | Single Family | 5/5 | 2,470 | $2,600,000 | $1,053 | 100% | Sep 18 |
| 817 Railroad Avenue | Single Family | 3/2 | 1,120 | $2,500,000 | $2,232 | 100% | Sep 21 |
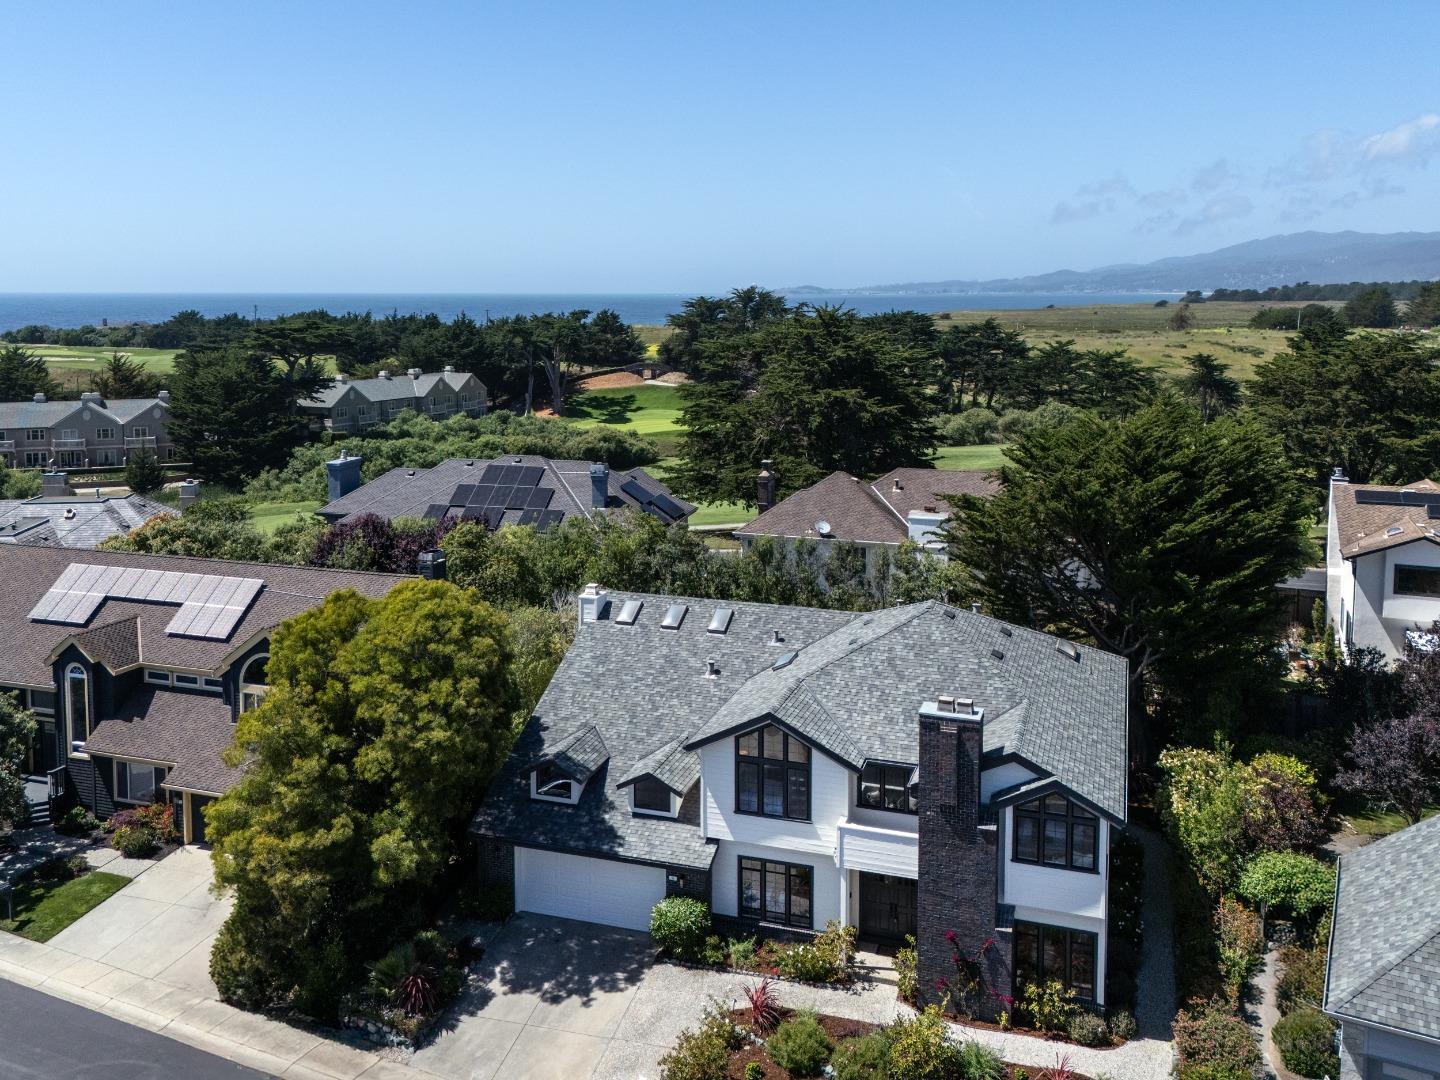
| 11 Fairway Place | Single Family | 4/3 | 3,450 | $2,345,000 | $680 | — | Sep 17 |
| 656 Terrace Avenue | Single Family | 4/3 | 2,397 | $1,940,000 | $809 | — | Sep 14 |
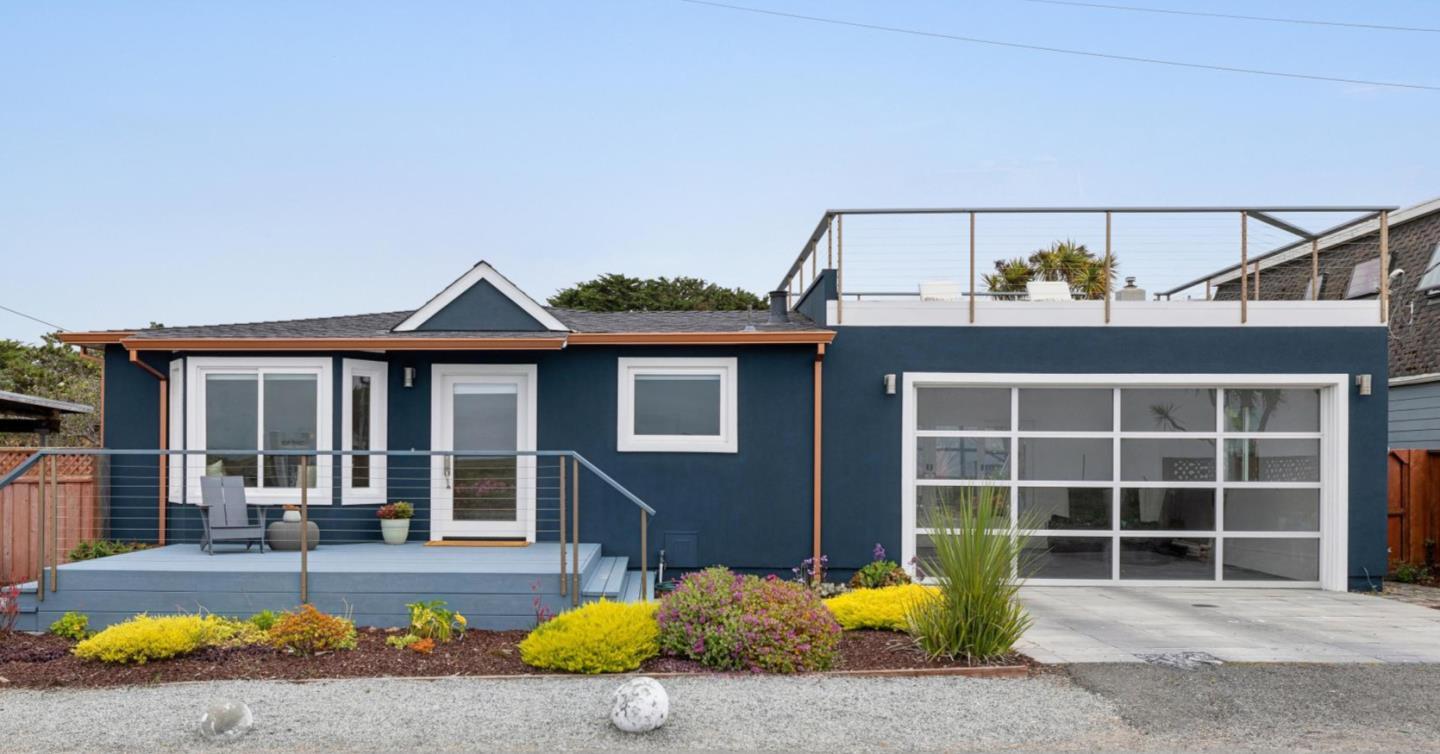
| 548 Miramar Drive | Single Family | 3/2 | 1,190 | $1,300,000 | $1,092 | 130.1% | Sep 16 |
| 413 Kehoe Avenue | Single Family | 3/2 | 1,310 | $1,275,000 | $973 | — | Sep 8 |
| 435 Dolores Avenue | Single Family | 2/1 | 1,100 | $1,000,000 | $909 | 91.3% | Sep 20 |
| 13 Erin Lane | Townhouse | 2/3 | 1,400 | $915,000 | $654 | — | Sep 3 |
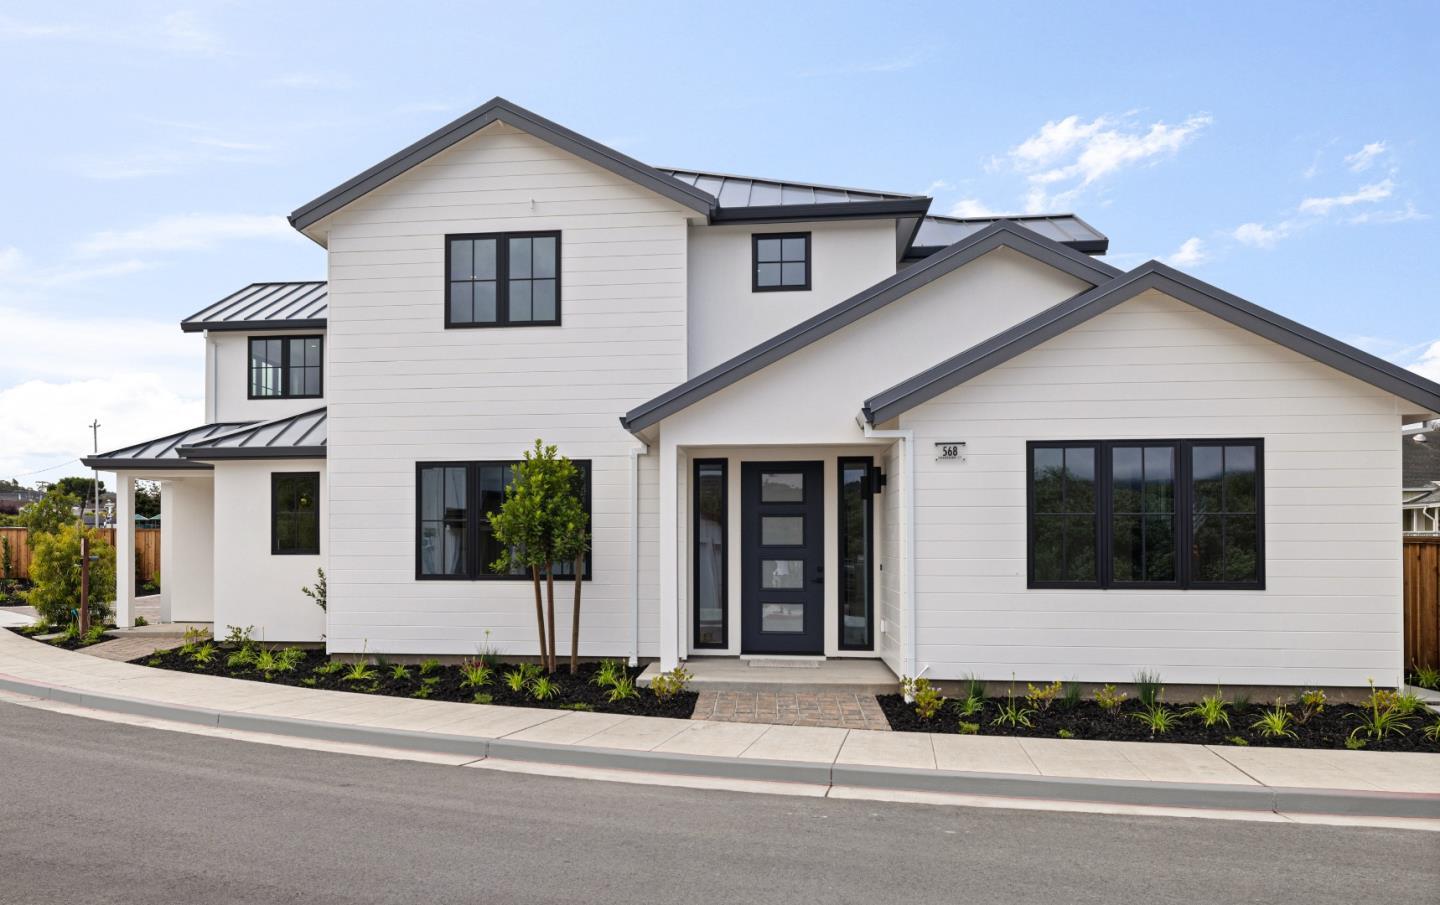
The roster shows all 8 closings recorded for September 2026. Days-on-market was reported for only 1 of 8 closings (11 Fairway Place, 52 days), which is too limited a sample to support any speed analysis. No speed section appears in this report.
The transaction that anchors September is 548 Miramar Drive — a 1,190-square-foot, three-bedroom home built in 1971, listed at $999,000, that closed at $1,300,000, or 130.1% of asking price. The gap between list and close ($301,000) is larger in dollar terms than the entire sale price of some properties in the metro area. Whatever drew multiple parties toward this address, the result is a matter of record.
At the other end of the spectrum, 817 Railroad Avenue — a 1960-vintage three-bedroom measuring 1,120 square feet — closed at $2,500,000, or $2,232 per square foot. That is the highest price-per-square-foot figure in the period by a considerable margin, and it sits alongside new construction at 568 Creekside Court ($2,600,000, $1,053/sq ft) as the two largest transactions by sale price. The Railroad Avenue figure is partly a function of the home's small footprint inflating the per-square-foot metric, but the absolute price — $2.5 million for a 66-year-old, 1,120-square-foot house — is notable on its own terms.
11 Fairway Place is the only sale with a days-on-market figure: 52 days. At 3,450 square feet and $2,345,000, it is the largest home by floor area in the period, and its $680 per square foot is the lowest among single-family sales. No list price was recorded for this property in the source data.
435 Dolores Avenue — a two-bedroom, one-bath home on an 11,598-square-foot lot — closed at $1,000,000, or 91.3% of its $1,095,000 list price. It is the only sale that closed below asking among the four with list prices recorded.
Where the market split
By segment
| Segment | Sales | Median Price | Median $/Sq Ft | Price Range |
|---|---|---|---|---|
| Single Family | 7 | $1,940,000 | $973 | $1,000,000 – $2,600,000 |
| Townhouse | 1 | — | — | $915,000 |
With only one townhouse closing (13 Erin Lane, $915,000), there is no median to report for that segment — a single data point does not support one. The sale price and per-square-foot figure ($654) are given in the roster for reference.
The seven single-family closings produced a segment median of $1,940,000 — which happens to equal the exact sale price of 656 Terrace Avenue — and a median price per square foot of $973. The spread within the segment, from $1,000,000 to $2,600,000, reflects how differently sized and positioned these homes are; grouping them by segment describes their legal form more than their market behavior.
By price band
| Price Band | Sales | Median Price | Median $/Sq Ft | Notes |
|---|---|---|---|---|
| Under $1M | 1 | — | $654 | Single sale; no median |
| $1M – $1.5M | 3 | $1,275,000 | $973 | |
| $1.5M – $2M | 1 | — | $809 | Single sale; no median |
| $2M – $3M | 3 | $2,500,000 | $1,053 |
Two of the four price bands — Under $1M and $1.5M–$2M — each contained a single sale, so no median is presented for either. The data requirements for a median are not met with one closing.
The $1M–$1.5M band (three sales: Miramar Drive, Kehoe Avenue, Dolores Avenue) carried a median of $1,275,000 and $973 per square foot. The $2M–$3M band (three sales: Creekside Court, Railroad Avenue, Fairway Place) produced a median of $2,500,000 and $1,053 per square foot. The per-square-foot figure in the upper band is elevated partly by the Railroad Avenue sale, where a small square footage produces a large $/sq ft regardless of absolute price.
The $1.5M–$2M band, with just one sale, was the quietest tier of the month.
Across the period
| Month | Closings | Median Price | Median $/Sq Ft |
|---|---|---|---|
| Jul 2026 | 2 | $2,545,000 | $1,156 |
| Aug 2026 | 14 | $1,750,000 | $797 |
| Sep 2026 | 8 | $1,620,000 | $941 |
July's two closings are too few to anchor any comparison — that figure reflects what happened to clear in the month, not the character of the market. August's 14 closings is the largest count in the three-month window and produced the period's lowest median price ($1,750,000) and lowest median per-square-foot ($797). September's eight closings sit in between: a lower median price ($1,620,000) than August but a higher median per-square-foot ($941).
The divergence between median price and median per-square-foot moving from August to September points to a mix-of-product effect: September's closings skewed toward smaller homes. The three sales above $2 million in September are large in price but two of the three — Railroad Avenue (1,120 sq ft) and Creekside Court (2,470 sq ft) — pull the per-square-foot figure up while the lower-priced sales in the $1M–$1.5M band (all under 1,320 sq ft) also carry relatively high per-square-foot figures. The result is a median $/sq ft of $941 against a median price that is lower than August's.
The active inventory at period's end stood at 34 listings with a median asking price of $2,270,000 — considerably above September's median close price of $1,620,000. Five listings were pending as of September 30.
What it means
For sellers: Seven of eight closings in September were single-family homes, and the price range was wide. The four sales for which list prices are recorded show results from 91.3% to 130.1% of ask, with a median of 100% — meaning the middle outcome was at asking. Four closings carried no list price in the source data. Active inventory entering October stands at 34, with a median active price of $2,270,000 against a September median close of $1,620,000; that gap exists in the record.
For buyers: The eight September closings took place across the full calendar month. One of the eight had a recorded days-on-market figure (52 days, at 11 Fairway Place), which is insufficient to characterize the pace of the market. Pending inventory sits at five as of September 30, and 34 active listings were on the market at month's end. The price band with the most activity was $1M–$1.5M and $2M–$3M, each with three closings; the $1.5M–$2M range produced only one.
For owners not transacting: The month's $13.875 million in volume came from eight transactions across a roughly $1.7 million spread. The Miramar Drive result — 30.1% above list — is the most unusual single data point in the period. The Dolores Avenue sale — 8.7% below list — sits at the other end. Both are single data points in a small-sample month, and neither should be read as representative of the broader market's direction.
Tim McMullen · CA DRE #02016832
[email protected] · (415) 691-9272