Half Moon Bay Q3 2026: 24 Closings, $44.6M in Volume, and a 1,120-Square-Foot Home That Fetched $2,232 per Foot
The period at a glance
| Metric | Q3 2026 |
|---|---|
| Total closings | 24 |
| Total volume | $44,588,999 |
| Median sale price | $1,750,000 |
| Median price per sq ft | $885 |
| Median square footage | 1,940 |
| Median lot size | 5,723 sq ft |
| Price range | $853,000 – $3,935,000 |
| List prices available | Yes |
| Days-on-market data | Limited — see note |
With 24 closings, this is a small sample. Every median here carries that caveat, and patterns in sub-segments deserve more caution than certainty.
The quarter's median sale price landed at $1,750,000 across all 24 transactions, driven almost entirely by single-family homes, which accounted for 21 of the 24 closings and $42.3 million of the $44.6 million in total volume. Median price per square foot across all segments was $885, but that figure conceals a wide band: the $1M–$1.5M price tier produced a median of $966 per square foot from six closings, while the $1.5M–$2M tier — five closings — came in at $738 per foot, a spread that reflects how sharply square footage scales with price in this market. The $3M–$5M tier, two closings, posted the highest median at $1,011 per square foot.
Days-on-market figures were recorded for only one of the 24 closings — 11 Fairway Place, at 52 days — so no speed analysis is possible for the quarter as a whole. List prices are available through the MLS source but versus-list figures were not supplied for this period, so no over-asking or under-asking section appears here.
The sales
The table below shows all 24 closings, ranked by sale price. Because the period total is 24, this roster is complete.
| Address | Segment | Beds | Sq Ft | Year Built | $/Sq Ft | Sale Price | Closed |
|---|---|---|---|---|---|---|---|
| 101 Spyglass Lane | Single Family | 5 | 4,452 | 2005 | $884 | $3,935,000 | Aug 28 |
| 201 Miramontes Avenue | Single Family | 5 | 3,244 | 1989 | $1,139 | $3,695,000 | Jul 31 |
| 311 Bayhill Road | Single Family | 4 | 3,110 | 2012 | $886 | $2,755,000 | Aug 4 |
| 568 Creekside Court | Single Family | 5 | 2,470 | 2026 | $1,053 | $2,600,000 | Sep 18 |
| 817 Railroad Avenue | Single Family | 3 | 1,120 | 1960 | $2,232 | $2,500,000 | Sep 21 |
| 211 Washington Boulevard | Single Family | 4 | 2,590 | 1988 | $927 | $2,400,000 | Aug 20 |
| 11 Fairway Place | Single Family | 4 | 3,450 | — | $680 | $2,345,000 | Sep 17 |
| 116 Eagle Trace Drive | Single Family | 5 | 3,430 | 1992 | $647 | $2,220,000 | Aug 13 |
| 535 Creekside Court | Single Family | 4 | 2,468 | 2026 | $857 | $2,115,000 | Aug 24 |
| 656 Terrace Avenue | Single Family | 4 | 2,397 | 2002 | $809 | $1,940,000 | Sep 14 |
| 2329 Burning Tree Road | Single Family | 4 | 3,470 | 1978 | $532 | $1,845,000 | Aug 13 |
| 412 Lee Avenue | Single Family | 3 | 1,819 | 2016 | $990 | $1,799,999 | Aug 27 |
| 443 Burning Tree Court | Single Family | 3 | 2,540 | 1979 | $669 | $1,700,000 | Aug 9 |
| 400 Miramar Drive | Single Family | 3 | 2,061 | 1969 | $738 | $1,521,000 | Aug 27 |
| 200 Filbert Street | Single Family | 3 | 1,460 | 1963 | $959 | $1,400,000 | Aug 18 |
| 432 Granelli Avenue | Single Family | 3 | 1,190 | 1964 | $1,172 | $1,395,000 | Jul 23 |
| 548 Miramar Drive | Single Family | 3 | 1,190 | 1971 | $1,092 | $1,300,000 | Sep 16 |
| 413 Kehoe Avenue | Single Family | 3 | 1,310 | 1967 | $973 | $1,275,000 | Sep 8 |
| 181 Shelter Cove Drive | Single Family | 3 | 1,780 | 1969 | $674 | $1,200,000 | Aug 3 |
| 435 Dolores Avenue | Single Family | 2 | 1,100 | 1963 | $909 | $1,000,000 | Sep 20 |
| 408 Belleville Boulevard | Single Family | 2 | 630 | 2013 | $1,508 | $950,000 | Aug 24 |
| 12 Patrick Way | Townhouse | 2 | 1,320 | 1992 | $705 | $930,000 | Aug 5 |
| 13 Erin Lane | Townhouse | 2 | 1,400 | 1996 | $654 | $915,000 | Sep 3 |
| 130 Troon | Condominium | 3 | 1,360 | 1990 | $627 | $853,000 | Aug 14 |
Four transactions are worth slowing down on.
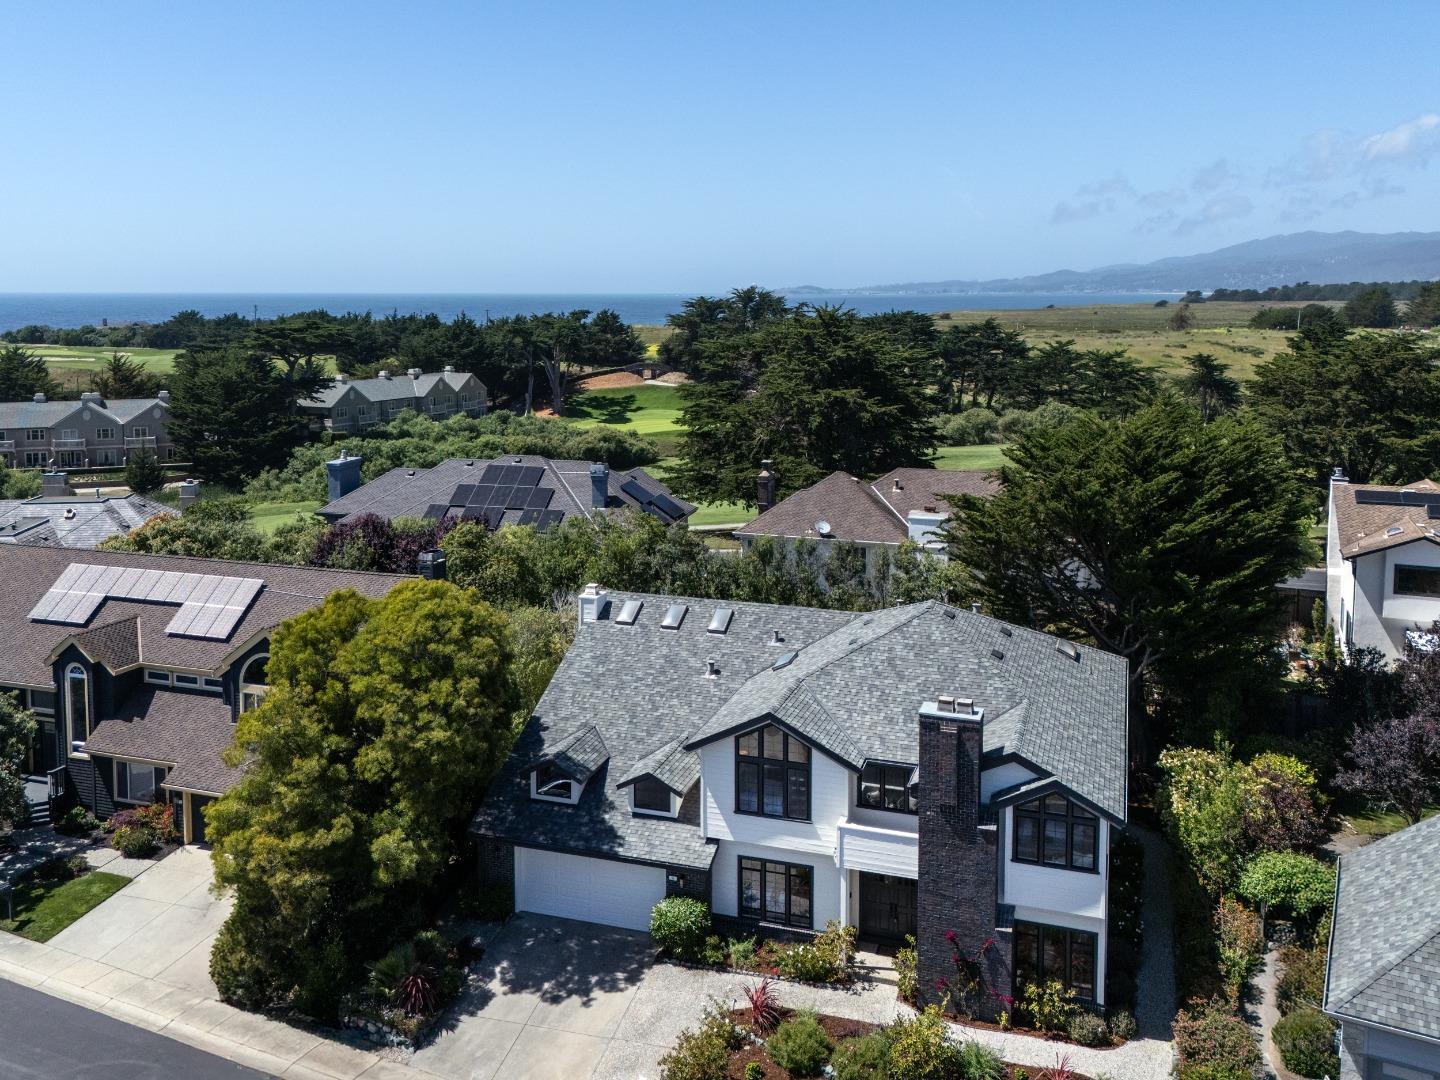
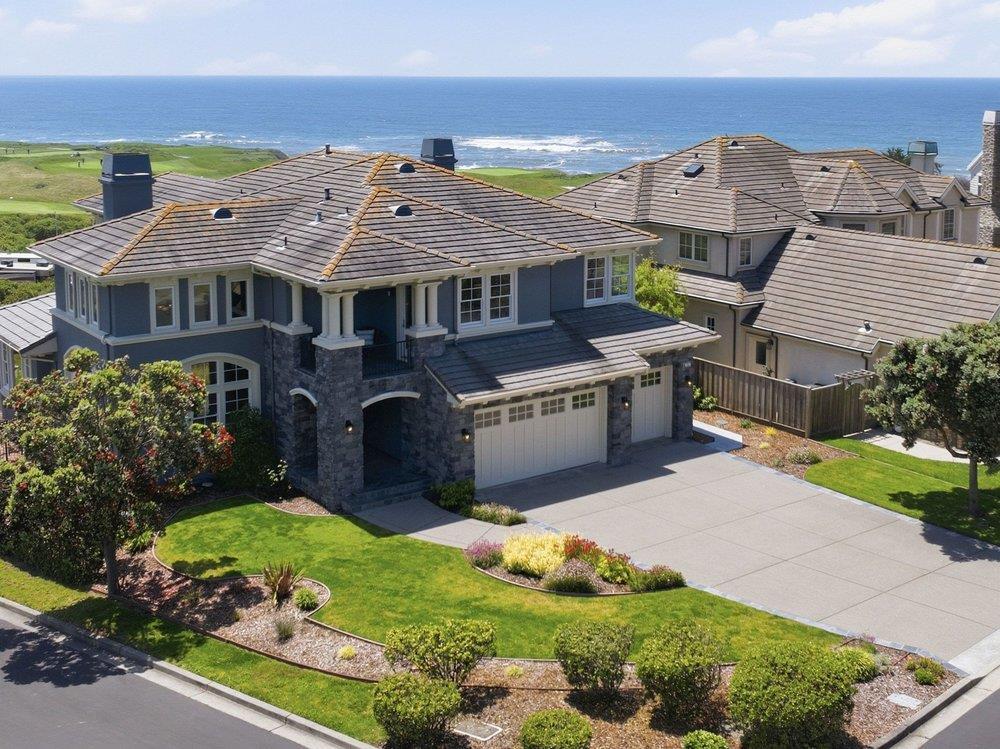
101 Spyglass Lane was the quarter's top close at $3,935,000 — a 4,452-square-foot, five-bedroom home on a 14,564-square-foot lot built in 2005, at $884 per square foot. It is the largest home by footprint in this roster and one of only two closings above $3 million.
817 Railroad Avenue produced the quarter's most arresting per-foot figure: $2,232 on a 1,120-square-foot, three-bedroom home built in 1960, closing at $2,500,000. The lot is 6,083 square feet. That per-foot rate is more than double the quarter's overall median of $885 and more than three times what the largest homes in the $2M–$3M tier achieved. No days-on-market figure was recorded for this transaction.
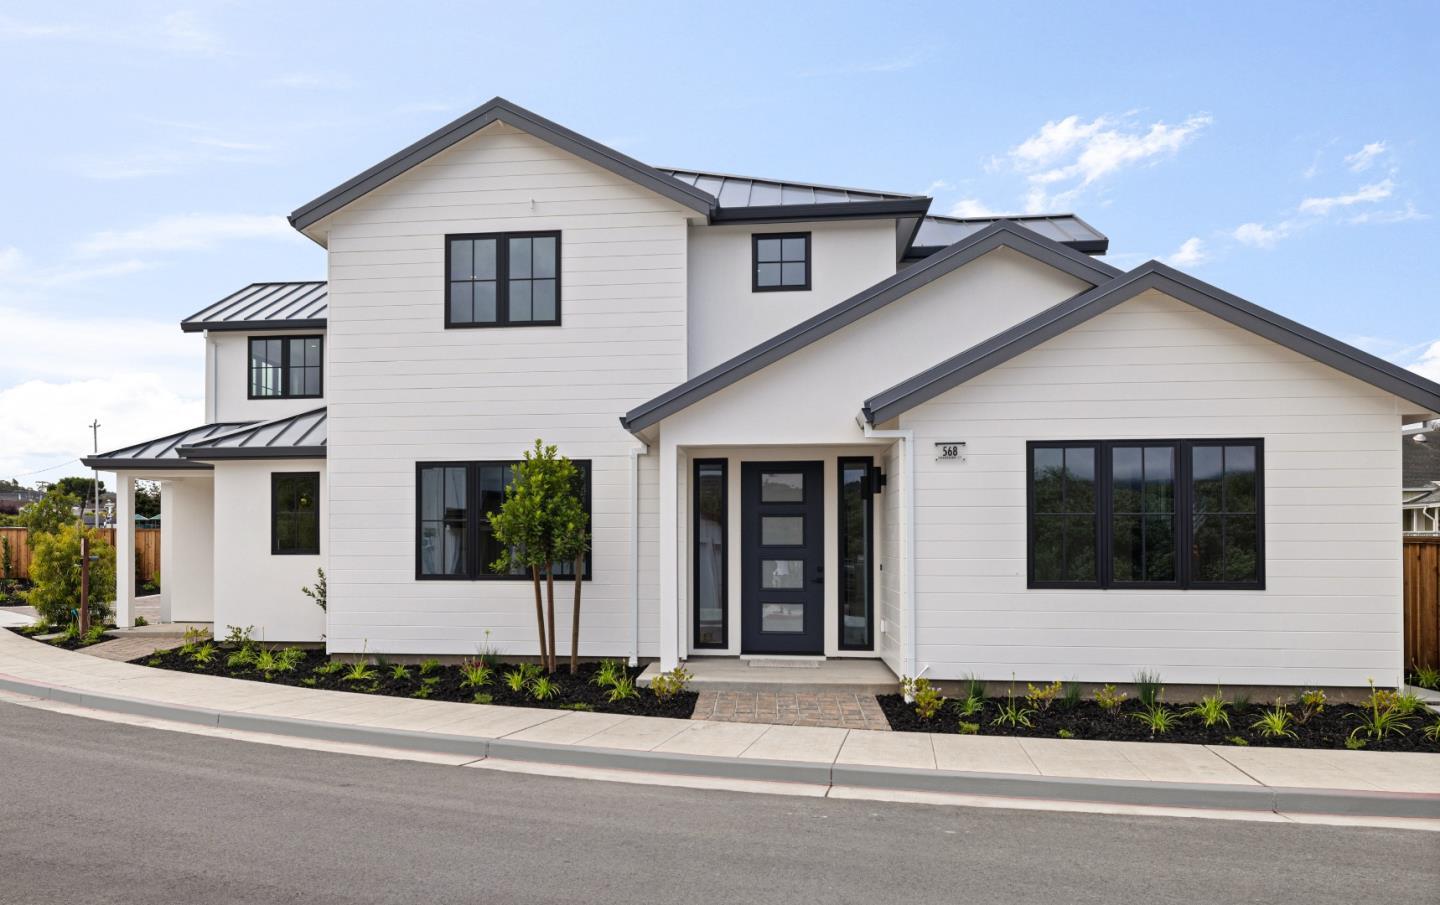
568 Creekside Court and 535 Creekside Court were the quarter's two new-construction closings, both built in 2026. They closed at $2,600,000 (2,470 sq ft, $1,053/sq ft) and $2,115,000 (2,468 sq ft, $857/sq ft) respectively — nearly identical footprints, a $485,000 price difference, and a $196-per-foot spread. Both carried no DOM figure.
11 Fairway Place is the only transaction with a recorded days-on-market figure: 52 days, closing at $2,345,000 on a 3,450-square-foot, four-bedroom home. At $680 per square foot, it was among the lower per-foot outcomes in the $2M–$3M band. Year built was not recorded in the MLS source.
Where the market split
By segment
| Segment | Closings | Price Range | Median Price | Median $/Sq Ft | Median Sq Ft |
|---|---|---|---|---|---|
| Single Family | 21 | $950,000 – $3,935,000 | $1,845,000 | $909 | 2,397 |
| Townhouse | 2 | $915,000 – $930,000 | $922,500 | $679 | 1,360 |
| Condominium | 1 | $853,000 | — | $627 | 1,360 |
Single-family homes drove the quarter. With 21 closings, they are the only segment with a statistically meaningful median; the single-family median price of $1,845,000 and median of $909 per square foot rest on a sample large enough to read with reasonable confidence.
The two townhouse closings — 12 Patrick Way at $930,000 and 13 Erin Lane at $915,000 — are too few to support a median as a trend indicator. Their range, $915,000 to $930,000, is noted as a reference point only. The sole condominium closing, 130 Troon at $853,000, has no median by definition.
By price band
| Price Band | Closings | Median $/Sq Ft |
|---|---|---|
| Under $1M | 4 | $679 |
| $1M – $1.5M | 6 | $966 |
| $1.5M – $2M | 5 | $738 |
| $2M – $3M | 7 | $886 |
| $3M – $5M | 2 | $1,011 |
The $1M–$1.5M band's median of $966 per square foot outpaced the $1.5M–$2M band's $738 — a $228-per-foot inversion that reflects the predominance of smaller, older homes in the lower band. The six closings in the $1M–$1.5M tier included several sub-1,400-square-foot homes from the 1960s and 1970s, where the land and location carry more of the close price relative to finished square footage. The $1.5M–$2M band's five closings included homes ranging from 1,819 to 3,470 square feet, pulling the per-foot rate down even as the nominal price climbed.
The $3M–$5M band's $1,011 per-foot median rests on two closings and should be read as a range marker rather than a trend.
Across the quarter
| Month | Closings | Median Price | Median $/Sq Ft |
|---|---|---|---|
| July 2026 | 2 | $2,545,000 | $1,156 |
| August 2026 | 14 | $1,750,000 | $797 |
| September 2026 | 8 | $941 | $1,620,000 |
Note: The September median price is $1,620,000 and median $/sq ft is $941.
July's two closings — 201 Miramontes Avenue at $3,695,000 and 432 Granelli Avenue at $1,395,000 — produced a median of $2,545,000 and $1,156 per square foot. With only two transactions, these figures describe those two sales, not the month as a market condition.
August was the quarter's working month: 14 of the 24 closings landed between August 1 and August 31, with a median price of $1,750,000 and $797 per square foot across that group. The volume and variety of August closings — spanning $950,000 to $3,935,000 — make it the quarter's most representative cross-section.
September's eight closings produced a median price of $1,620,000 and a median of $941 per square foot. The higher per-foot figure relative to August, despite a lower median price, reflects the presence of several small-footprint homes in September's closing roster: 817 Railroad Avenue (1,120 sq ft, $2,232/sq ft), 548 Miramar Drive (1,190 sq ft, $1,092/sq ft), and 435 Dolores Avenue (1,100 sq ft, $909/sq ft) each contributed to that rate.
What it means
For sellers: Twenty-one of 24 closings were single-family homes, and the segment's $1,845,000 median held across a broad range of sizes and vintages. The per-foot spread within the single-family segment ran from $532 (2329 Burning Tree Road, 3,470 sq ft, 1978) to $2,232 (817 Railroad Avenue, 1,120 sq ft, 1960) — a ratio of more than four to one. Larger square footage did not consistently produce higher per-foot returns this quarter; in several cases the opposite held.
For buyers: The $1.5M–$2M band carried five closings and the widest per-foot range of any active tier, from $532 to $990 per square foot across homes ranging from 1,819 to 3,470 square feet. The two new-construction Creekside Court closings — similar footprints, different prices — illustrate that within-neighborhood variation was present even on comparable product. Days-on-market data was recorded for only one of the 24 closings, so absorption-rate conclusions are not available from this quarter's MLS record.
For owners not transacting: Total volume for the quarter was $44,588,999 across 24 closings — an average of roughly $1.86 million per transaction. The quarter's activity was concentrated in August (14 closings), with the highest individual close at $3,935,000 and the lowest at $853,000. This is the recorded transaction record for Q3 2026; it does not represent all properties that were listed or listed and withdrawn.
Tim McMullen · CA DRE #02016832
[email protected] · (415) 691-9272
More from Half Moon Bay
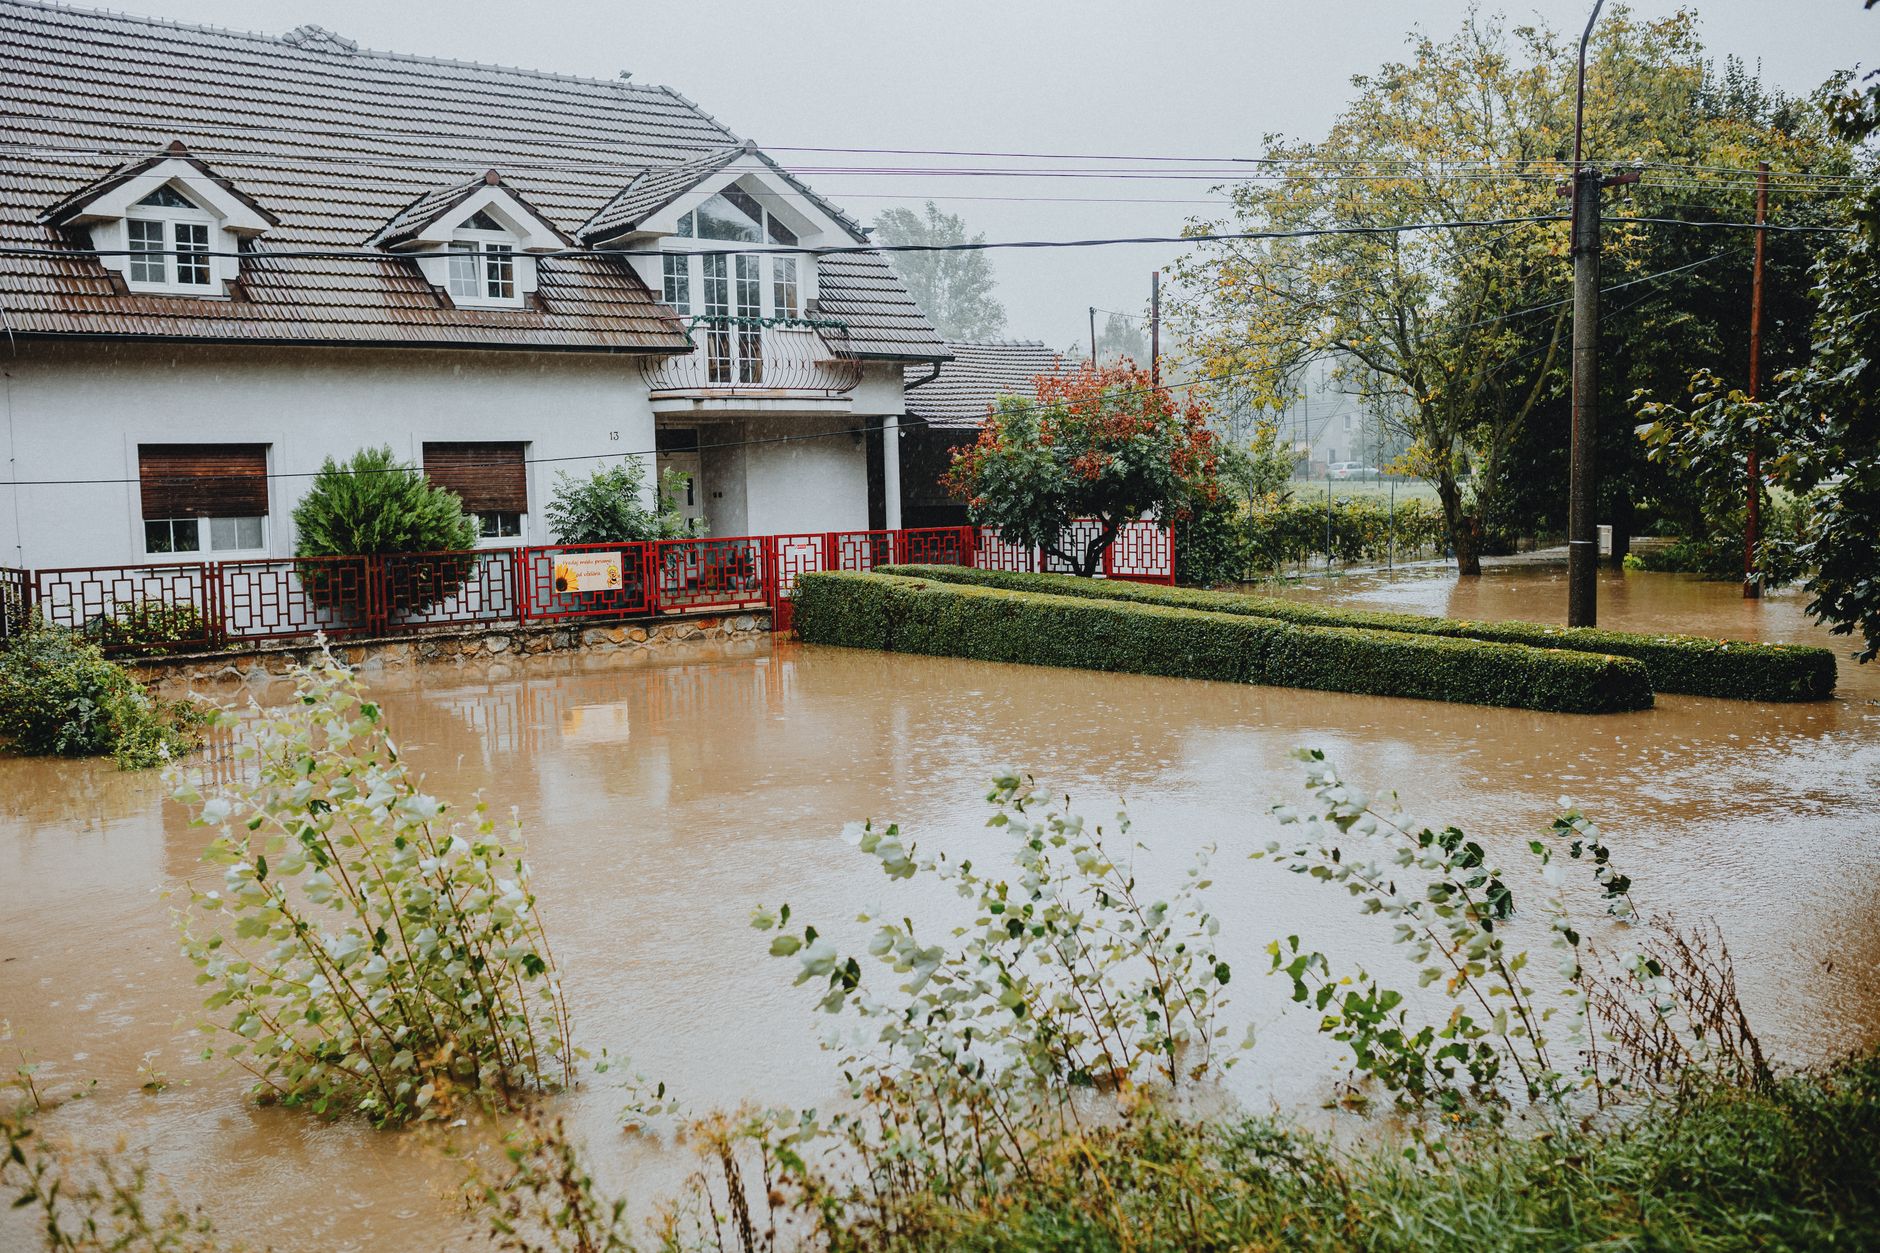
Half Moon Bay's flood zone can change block by block — here is how to find yours
More than 2,500 homes in this parcel record were built before 1980 — before modern flood-mapping standards existed. Here is how to find your zone, read what it requires, and understand what an elevation certificate does and does not do for you.
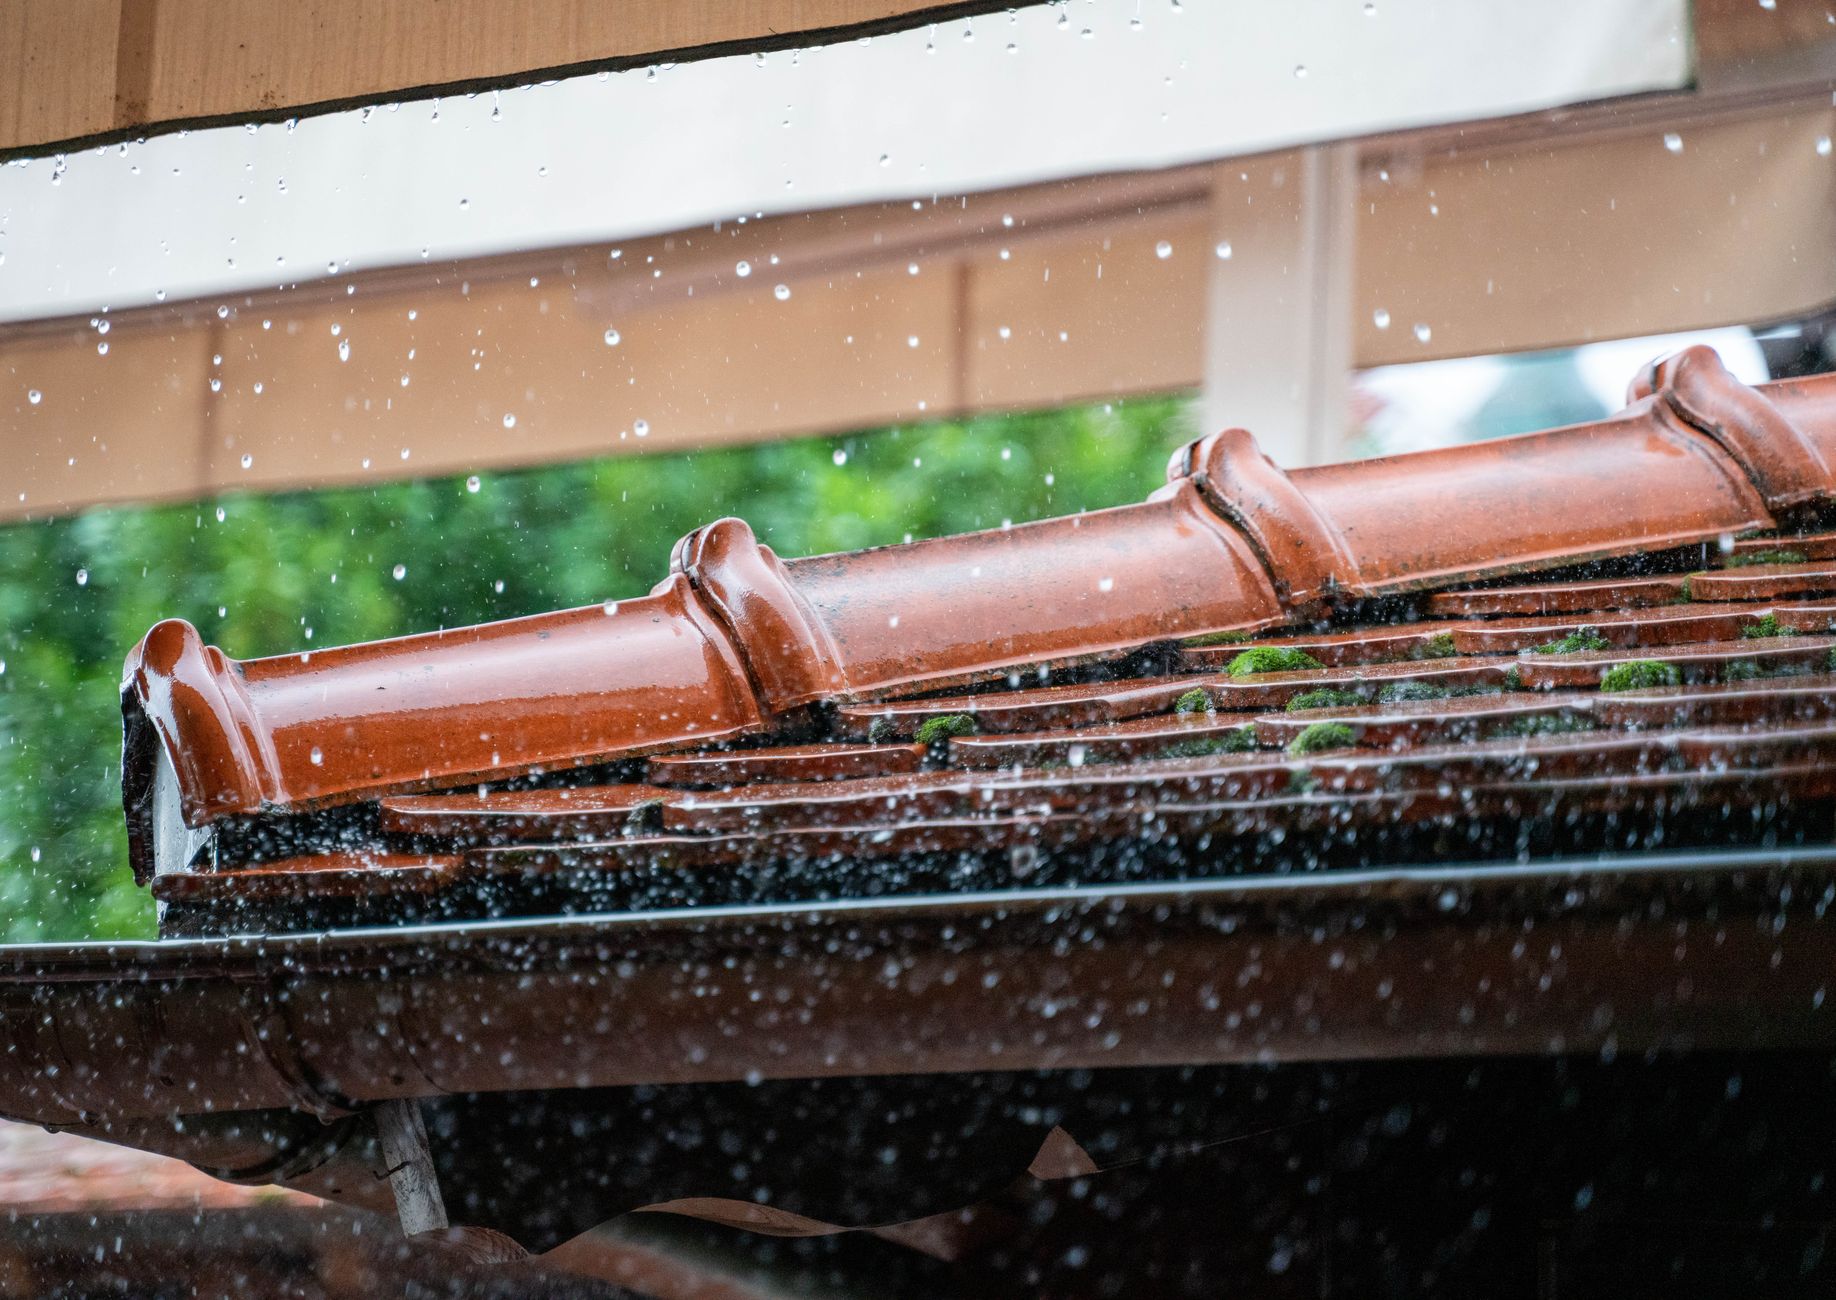
Clean Your Gutters Before the Rains Hit Half Moon Bay
The Pacific storms that roll into Half Moon Bay arrive with little warning and dump serious water fast. A clogged gutter on a house that's been sitting dry all summer can do real damage in a single night.
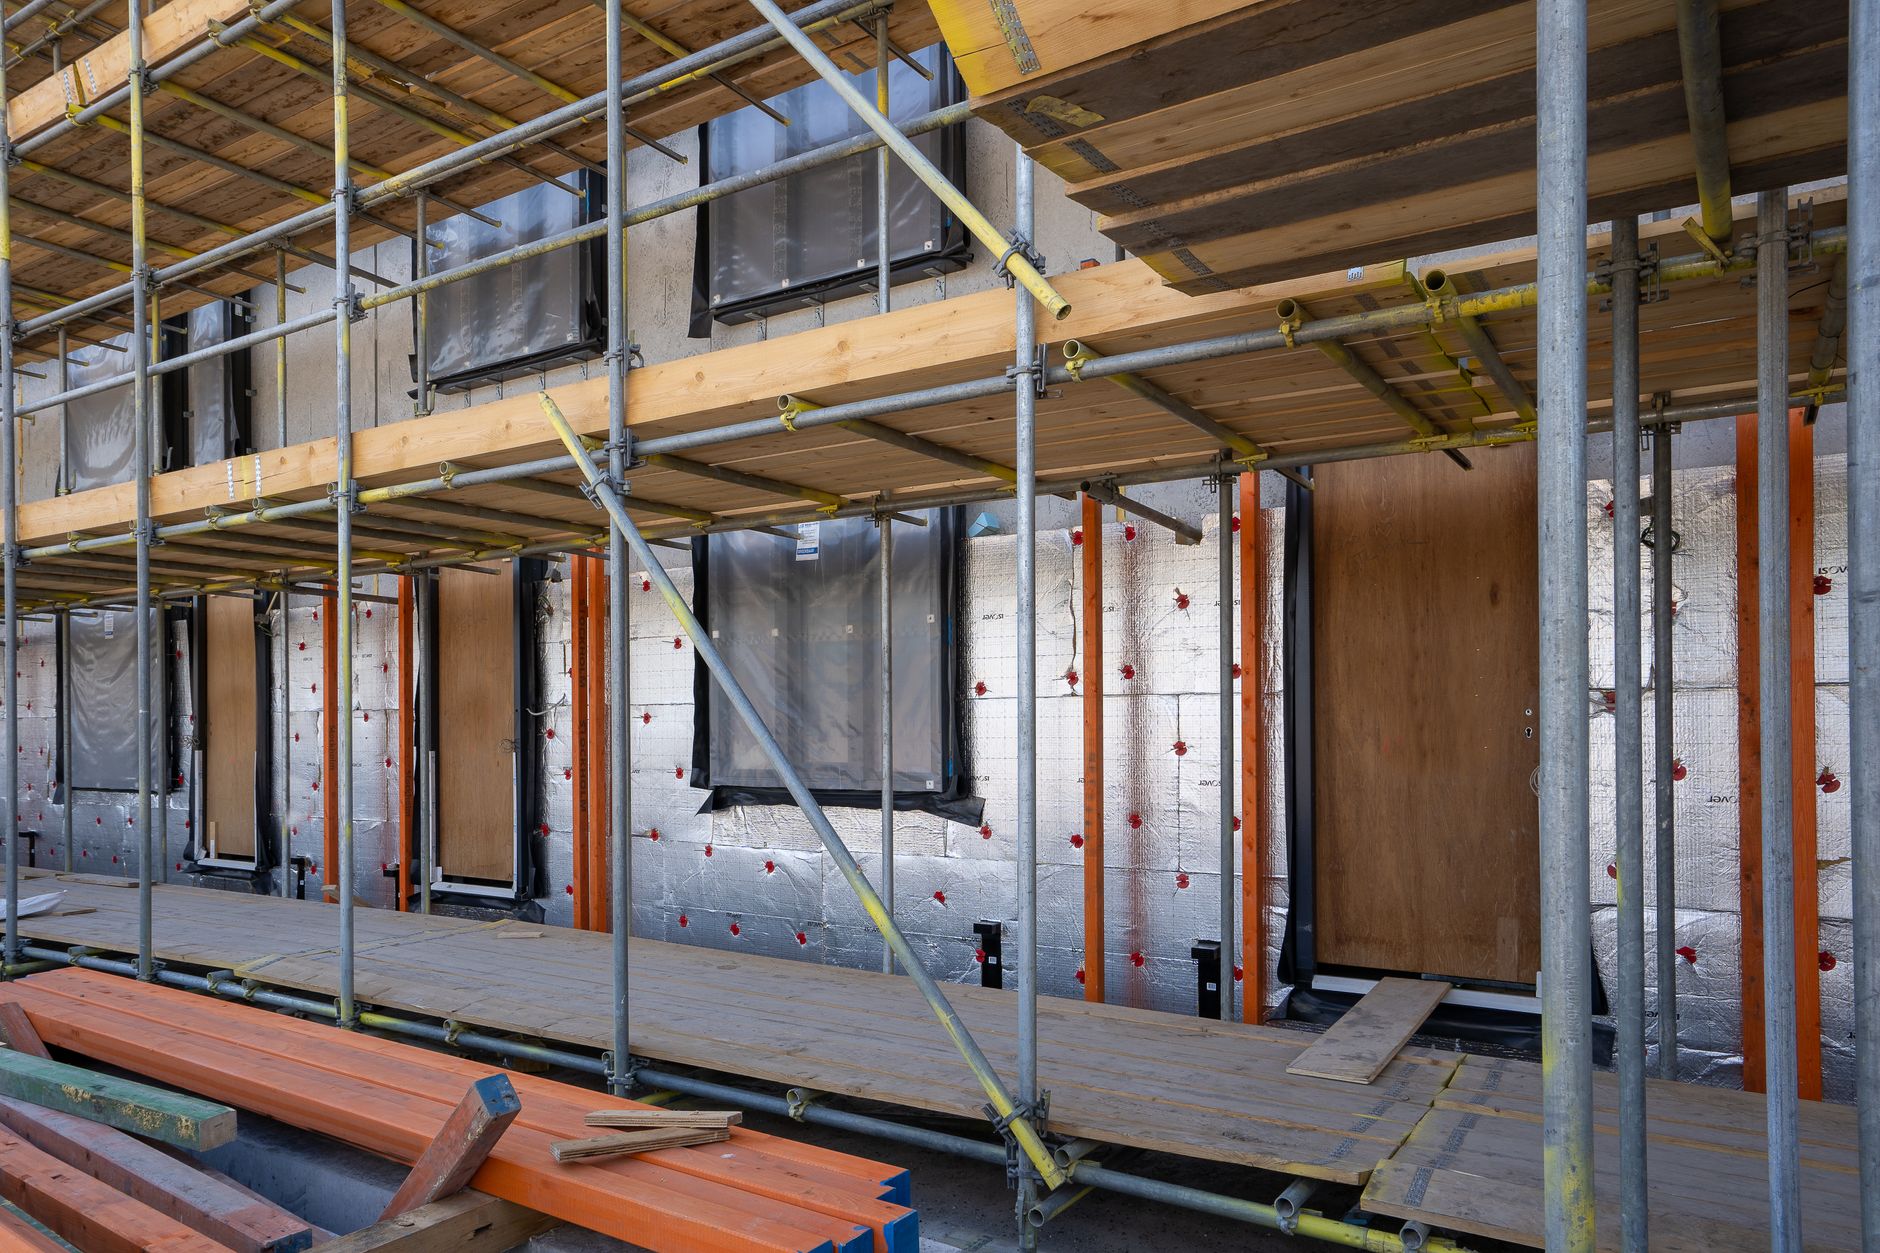
What Your Half Moon Bay Home Is Missing, Based on When It Was Built
More than 2,500 homes in this market were built before 1980, when insulation standards were thin and single-pane glass was the default. Here is what to expect by era, and a practical order for fixing it.