Half Moon Bay's Best and Worst Sales Are $518 Per Square Foot Apart
A market where condition has room to matter
Of the roughly 5,900 parcels in this market's record, about 2,550 single-family homes were built before 1980 — nearly half the single-family stock. That means a large share of what trades here started life with original kitchens, single-pane windows, and electrical panels that predate modern loads. Whether those homes have been updated since is one of the things that shows up in the price-per-square-foot spread.
The figures below come from recorded sales: 140 single-family closings and 12 condo and townhome closings in the trailing 12 months, and 272 single-family closings and 30 condo and townhome closings over the trailing 24 months.
Half Moon Bay's homes, from the record
| Built | Homes |
|---|---|
| before 1940 | 253 |
| 1940-1959 | 347 |
| 1960-1979 | 1,946 |
| 1980-1999 | 1,855 |
| 2000 or later | 703 |
| Single-family homes | 4,280 |
|---|---|
| Median lot | 6,710 sq ft |
| On an acre or more | 61 |
| Median size | 1,970 sq ft |
5,104 of 5,942 parcels in this market's record have a known build year.
Single-family homes: a wide band
Over the trailing 12 months (140 sales, 139 with square footage), the median single-family sale price was $1,600,000, at a median of $802 per square foot. The 10th-percentile sale came in at $635 per square foot; the 90th percentile reached $1,153. That is an $518-per-square-foot gap between the lower and upper ends of a broadly similar category.
The 24-month picture (272 sales, 271 with square footage) is nearly identical in shape: median $1,603,750, median $831 per square foot, with a 10th-to-90th range of $633 to $1,172. The consistency across both windows suggests the spread is structural, not a blip.
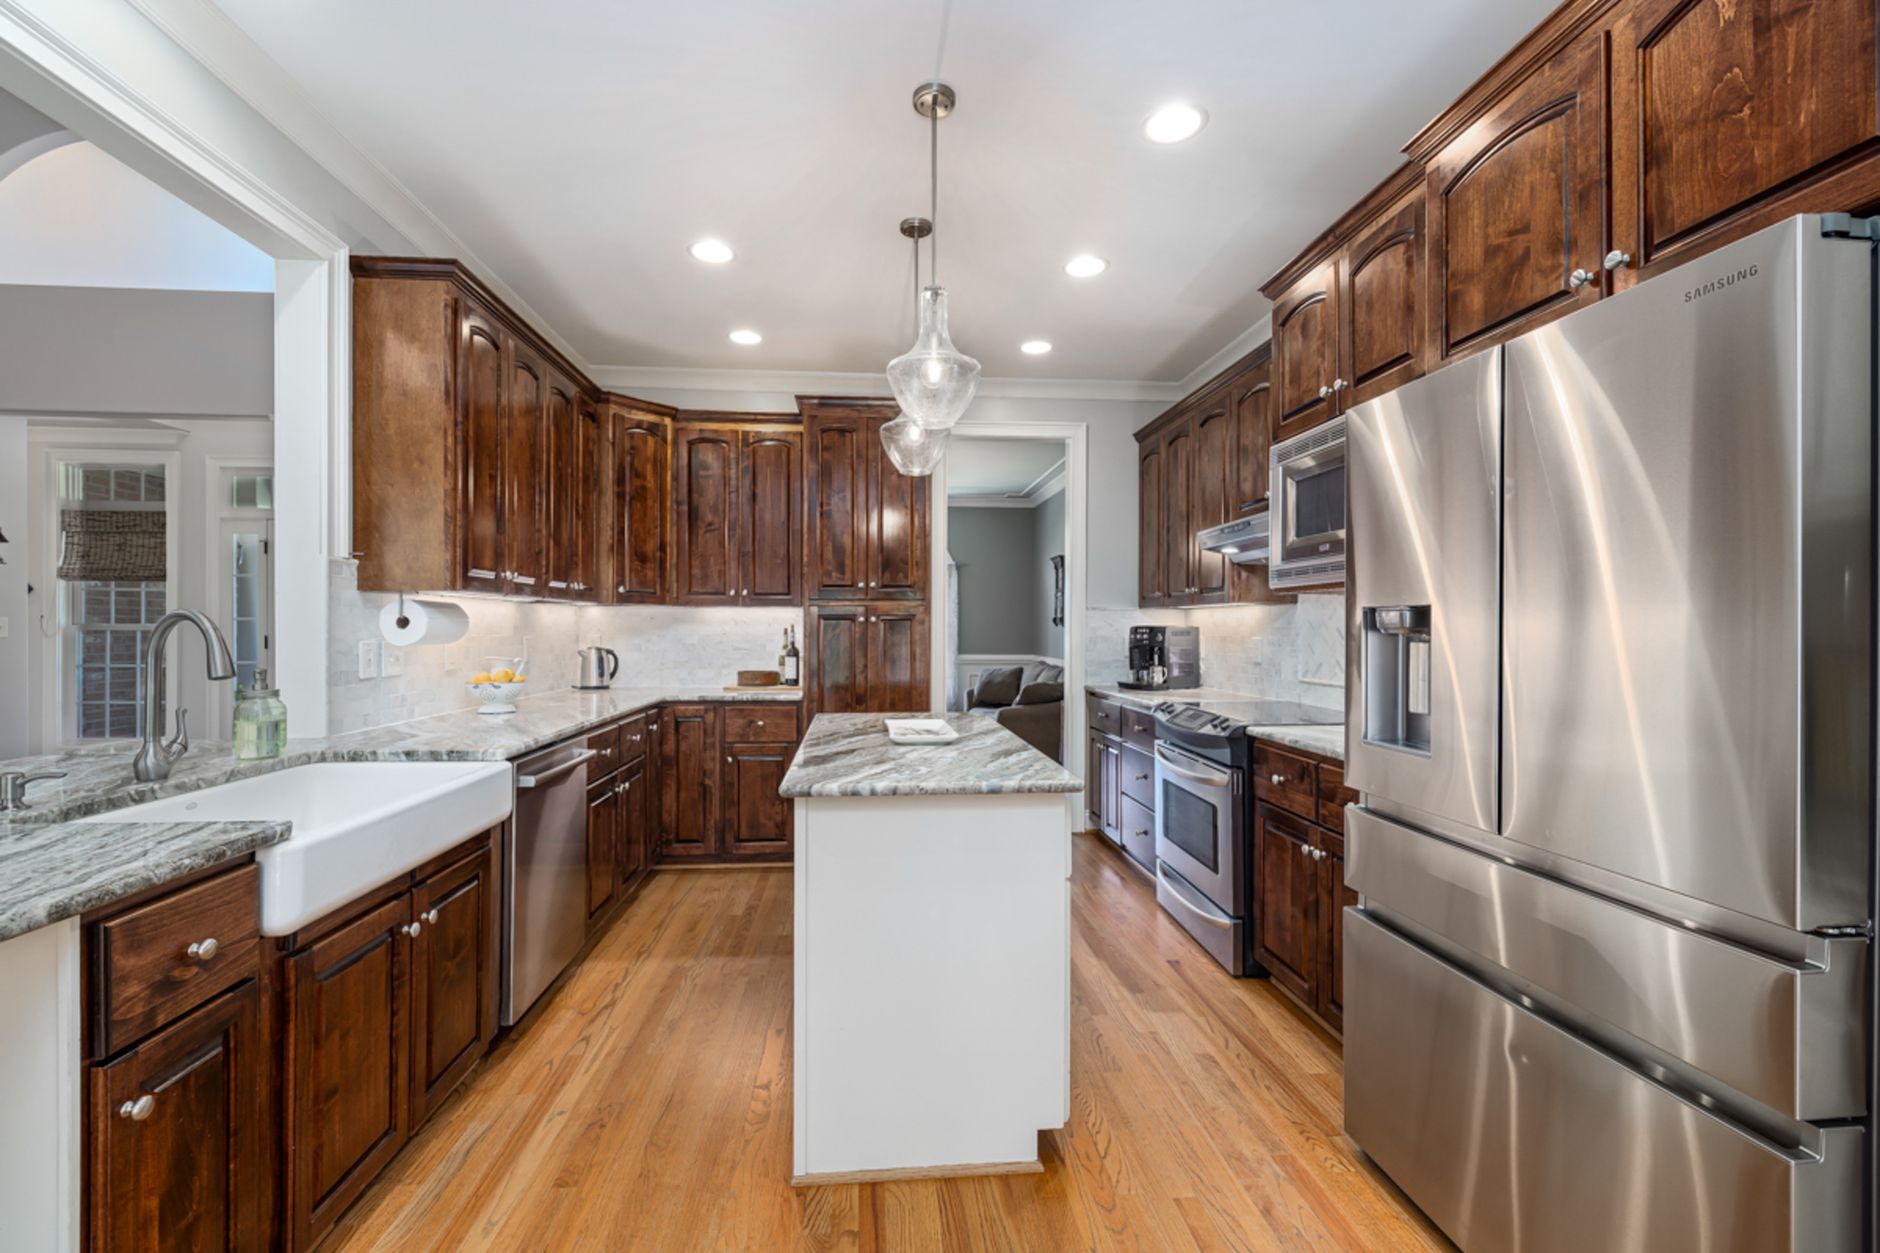
What descriptively separates the lower end from the upper end is not any single feature — price reflects the whole of what a buyer and seller agreed to on a specific day. But the homes that have recorded at the lower end of the per-square-foot range tend to share recognizable characteristics: deferred maintenance visible at inspection, original bathrooms and kitchens, older mechanical systems, and sometimes functional but dated floor plans with poor natural light. Many are 1960s and 1970s tract homes on standard 6,000-square-foot lots — the core of the local stock — that have not been touched in decades.
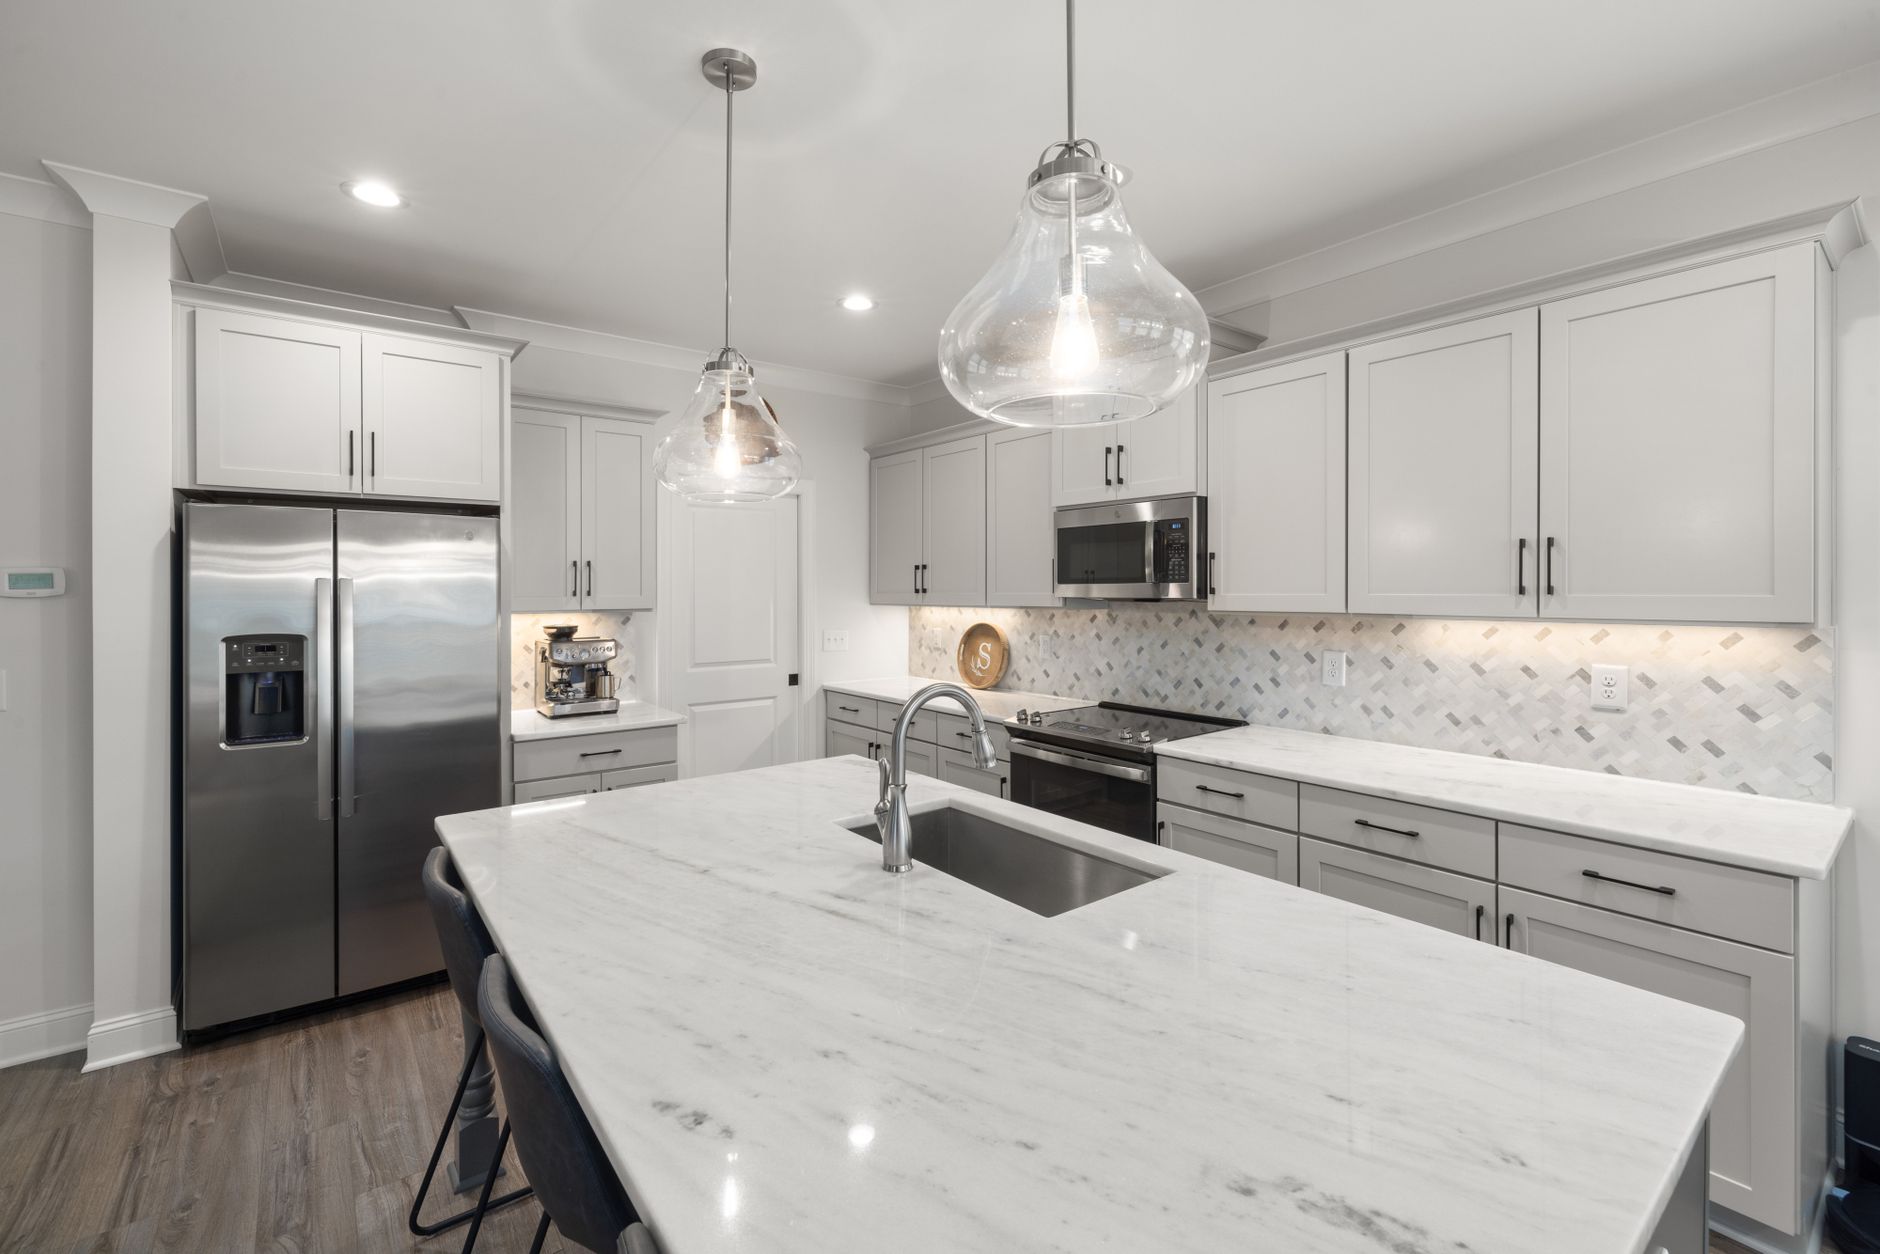
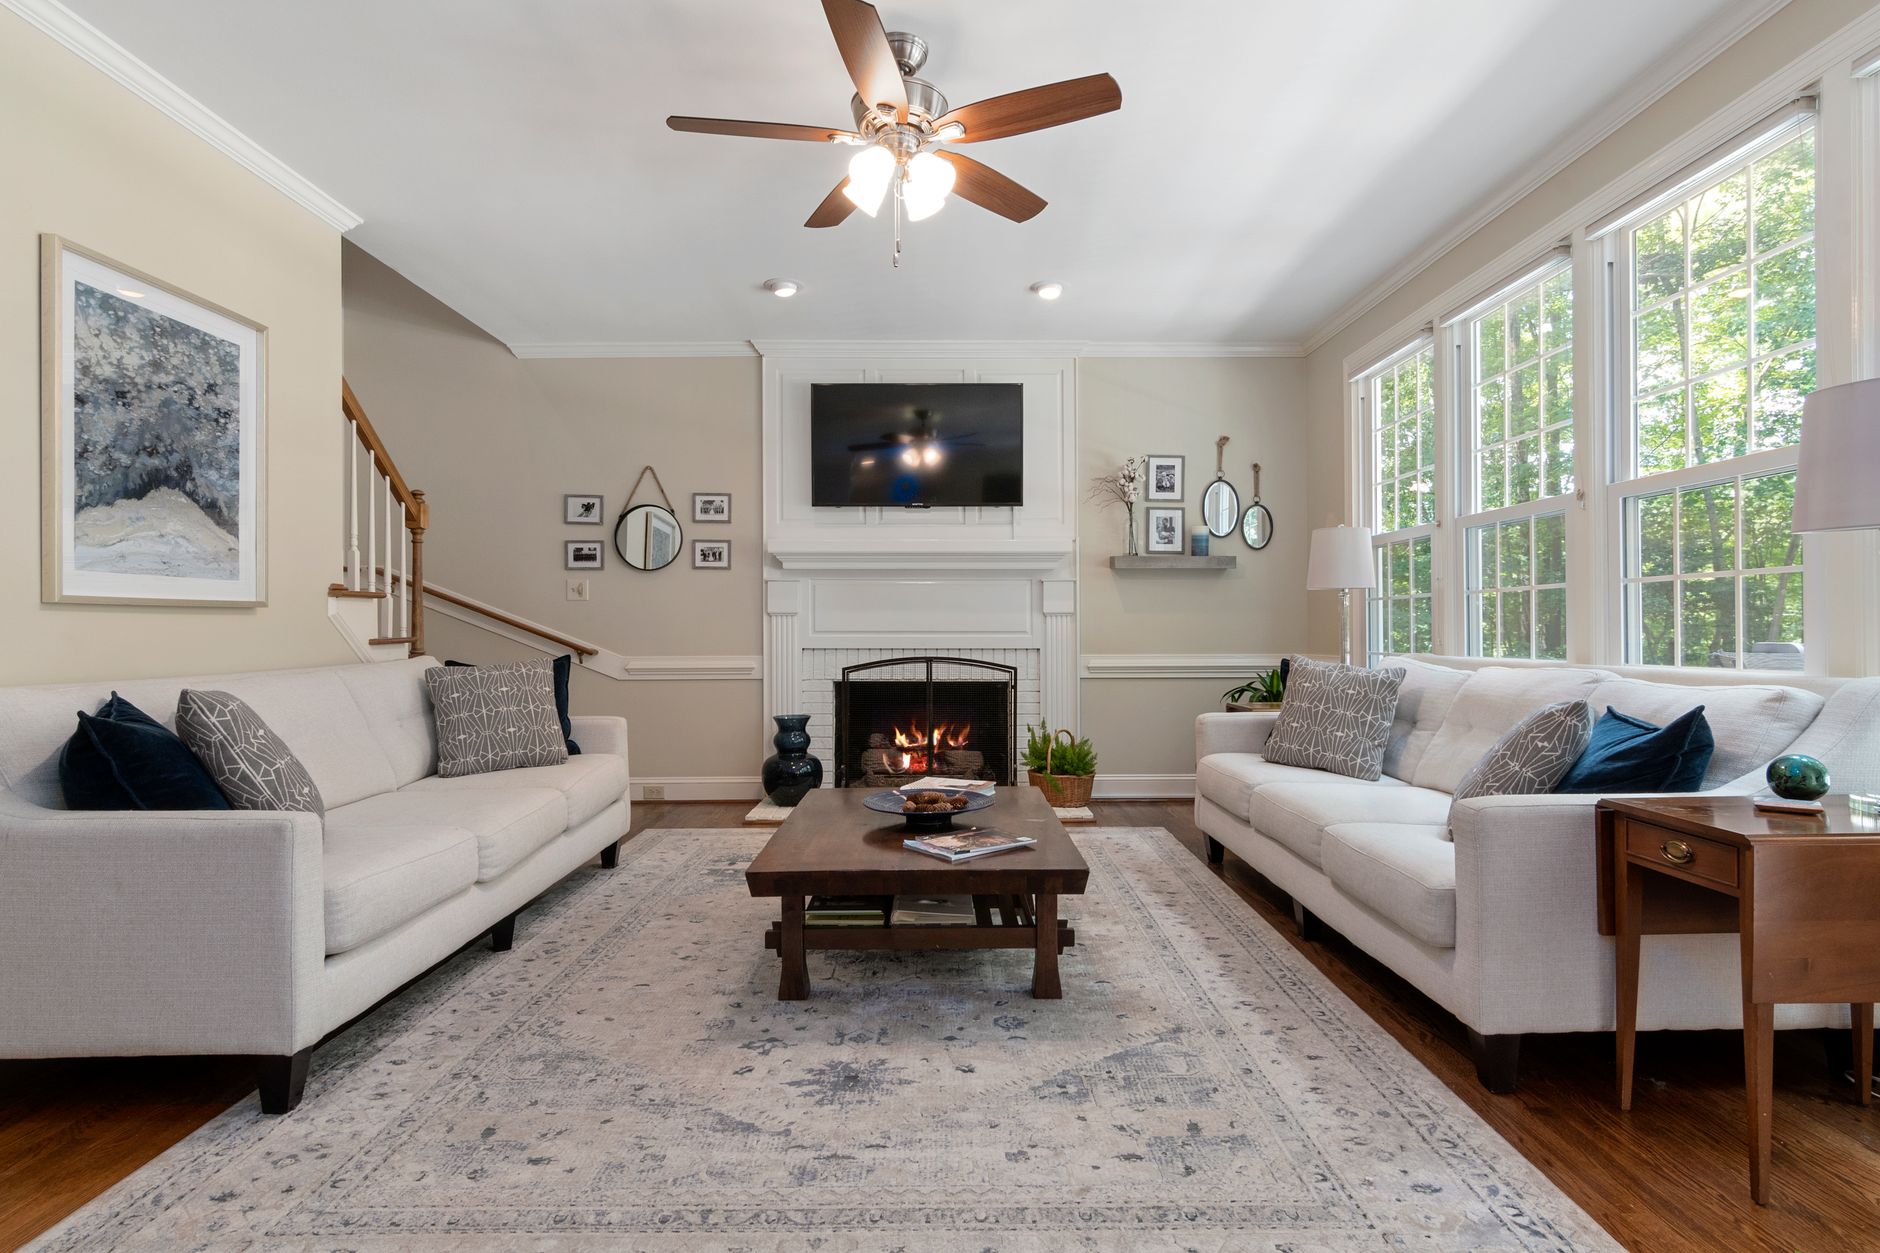
Homes at the upper end of the range tend to be described in listing records as having updated kitchens and baths, replaced windows, and current electrical and HVAC systems. Some are newer builds from the post-2000 cohort (703 parcels in this record), which arrive with insulation, panel capacity, and layouts that older homes lack without renovation. Others are older homes that have been substantially reconfigured — walls moved, square footage added with permits, or systems brought to current standard.
It is worth noting that Half Moon Bay's coastal climate puts real stress on materials. Salt air, persistent marine layer, and wet winters accelerate wood rot, rust, and paint failure. A home that looks merely dated may be carrying deferred maintenance that an inspection would price out; a home that looks move-in ready may have had that work done recently and correctly, or may have had it done cosmetically. The sales record cannot tell you which.
Condos and townhomes: narrower spread, still meaningful
The condo and townhome pool is smaller — 12 sales in the trailing 12 months, 30 over 24 months — so the figures carry more noise. With that caveat, the 24-month median landed at $812,500, with a median of $769 per square foot and a 10th-to-90th range of $550 to $885. That $335-per-square-foot gap is proportionally similar to the single-family spread.
Condos present a different update picture than detached homes. Individual owners control finishes and fixtures, but the building envelope, elevators, roofs, and common systems are the HOA's domain. A unit with a renovated kitchen sits inside a structure whose condition depends on the association's reserve funding and maintenance history — neither of which shows up in a per-square-foot figure. Sales at the lower end of the condo range sometimes reflect units with dated interiors; sometimes they reflect buildings with known deferred maintenance on common elements.
What the spread does not tell you
Per-square-foot figures are a rough sorting tool, not a pricing formula. A 1,200-square-foot home and a 2,800-square-foot home in the same neighborhood will not price at the same per-square-foot rate even if both are fully updated — larger homes generally carry a lower per-square-foot price simply because of scale. Lot size, orientation, proximity to Highway 1 noise, and the specific block all move prices in ways the broad percentiles cannot isolate.
If you are trying to understand where a specific home sits in this range, that is a conversation for a licensed appraiser or an agent with access to the full comparable set — not a calculation from market-wide medians.
Tim McMullen · CA DRE #02016832
[email protected] · (415) 691-9272
More from Half Moon Bay
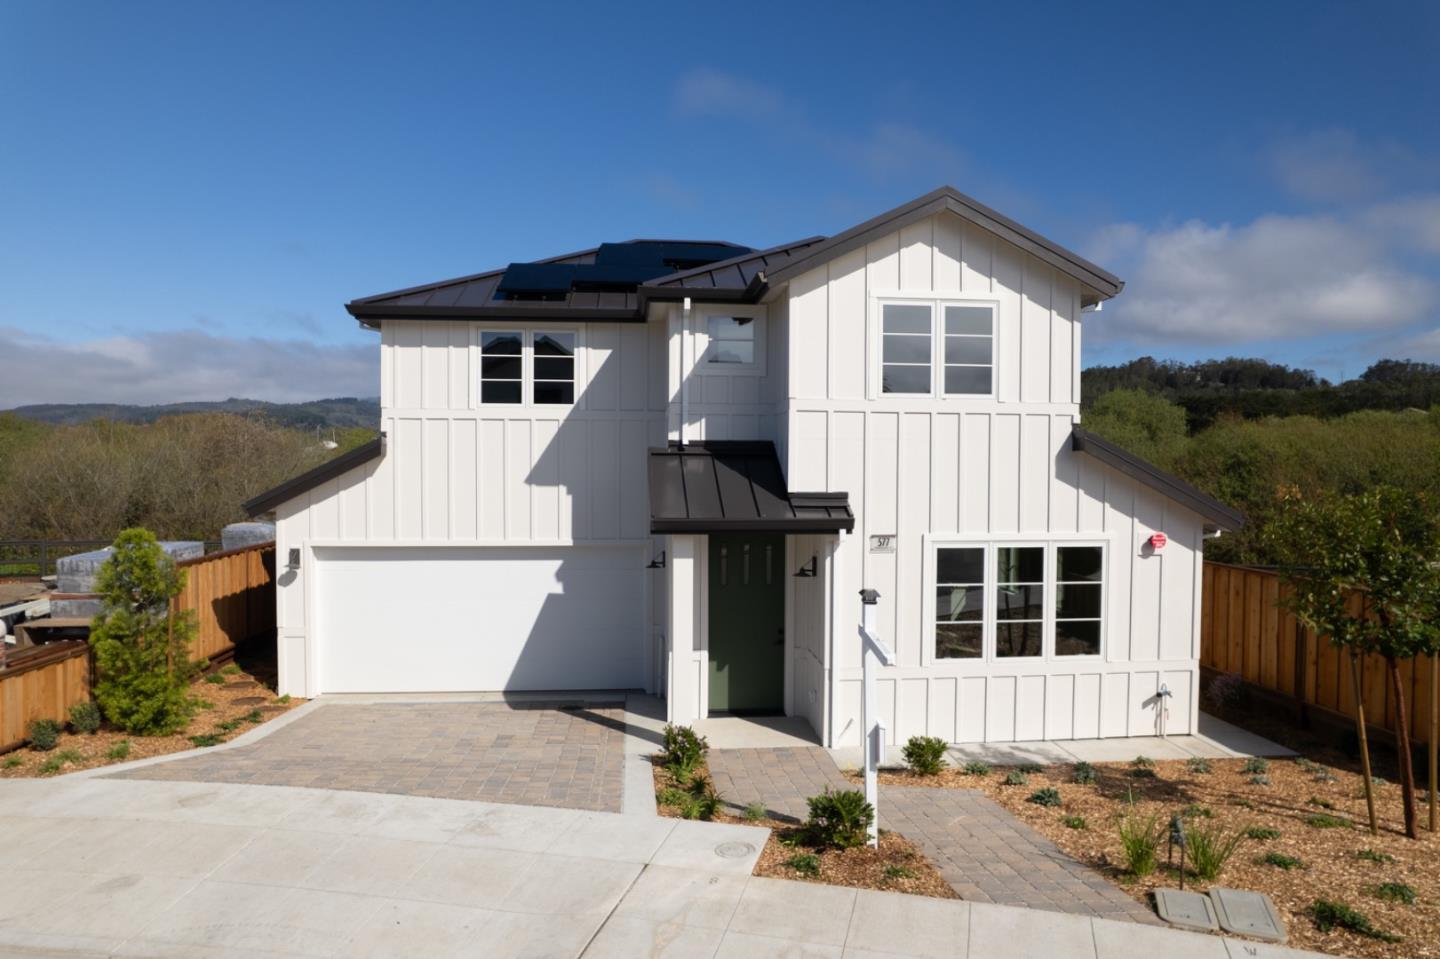
577 Creekside Court went pending at $1.75M — the only move Half Moon Bay made Monday
A quiet Monday in Half Moon Bay: one single-family home at 577 Creekside Court went pending, listed at $1,748,000. No new listings, no recorded closings.
Half Moon Bay's Pre-1980 Homes and the Permit Gap No One Talks About
Nearly half the homes in this parcel record were built before 1980. That era's DIY additions and garage conversions show up in permit histories — or don't. Here is what that means when you sell.
Half Moon Bay Has 4,280 Single-Family Homes. Most Could Qualify for a JADU.
More than 4,280 single-family homes sit in Half Moon Bay's parcel record, and state law now makes it straightforward to create a small second unit inside most of them—if you know the rules.